Academic Job Application Outcomes
It’s academic job hunting season, and a new group of young scientists are sending in their applications, getting called in for video interviews, and hopefully visiting campuses on physical interviews. I went through the gauntlet last year, and luckily came out with a position I’m happy with. I was struck by how little information was out there for the process while I was in it, and kept reasonably good notes about my experience thinking it could help candidates in the future.
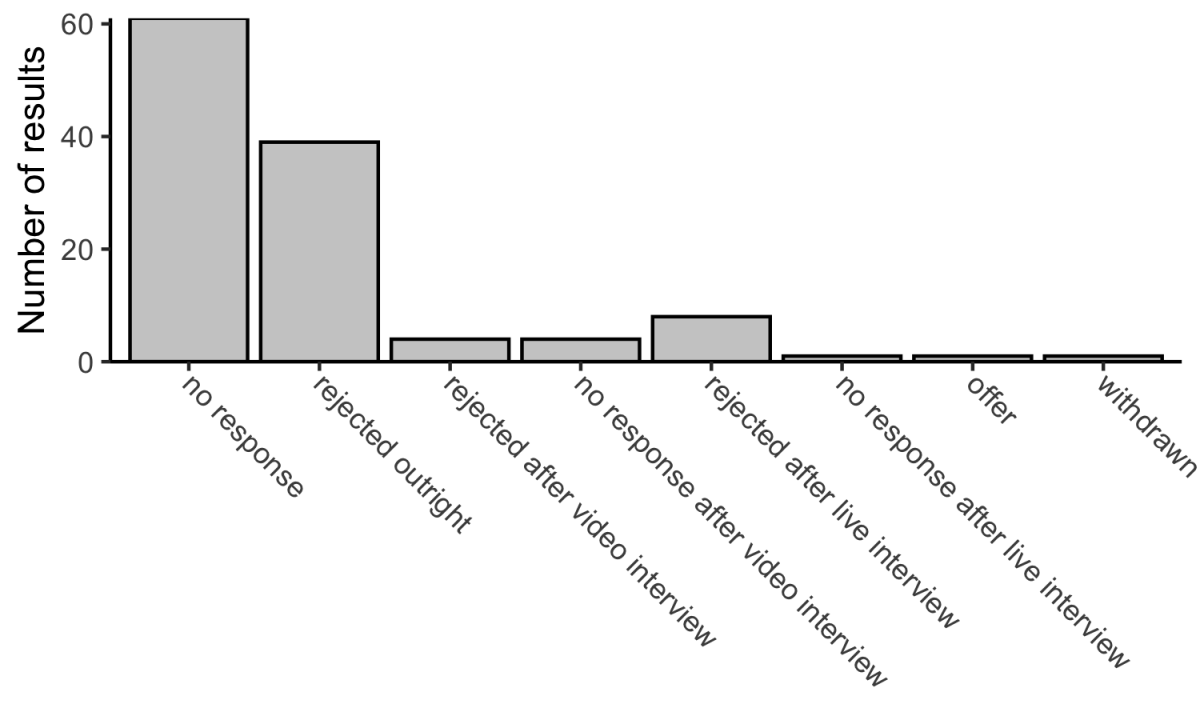
I submitted right around 120 applications. I don’t think I was the strongest applicant, but I don’t think I was the worst applicant either. Roughly half of my applications never got any responses. Another 1/3 were outright rejections, which trickled in over time. Thus, 5/6 were complete dead-ends.
Of the remaining 1/6, I had ten Skype / Zoom interviews, most of which didn’t go anywhere. I also did about ten physical interviews. Some interviews were rejections I received shortly after the trip, while others were rejections I received as I notified the departments that I had an offer. There was one application that lead to an interview (that I would have been quite excited about) but I had just accepted so I had to pass and withdraw my application. Here’s a plot breaking these results down.
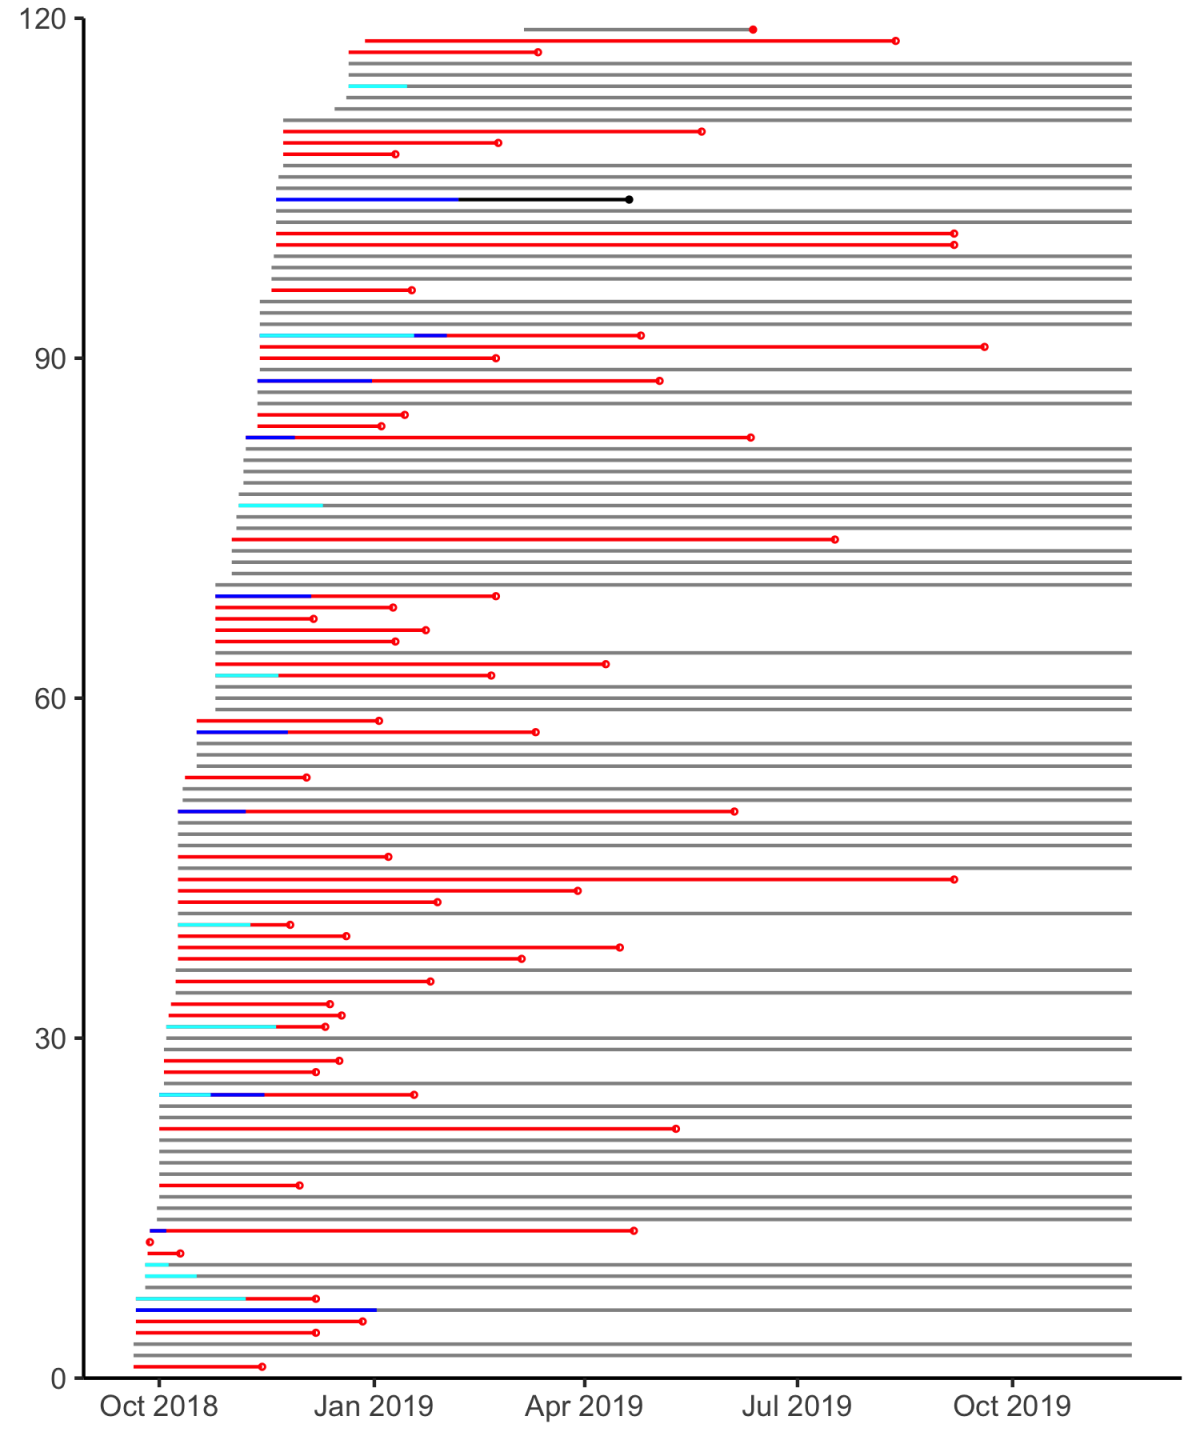
But you don’t know the final outcome when you’re in the middle of the job search and waiting for the responses to come in. Well, here’s the timing of all of my job applications and when I was notified of the outcomes.
The above plot is pretty comprehensive, but not particularly helpful for assessing how long I had to wait in between the key steps of each application. So here’s that information as a series of histograms:
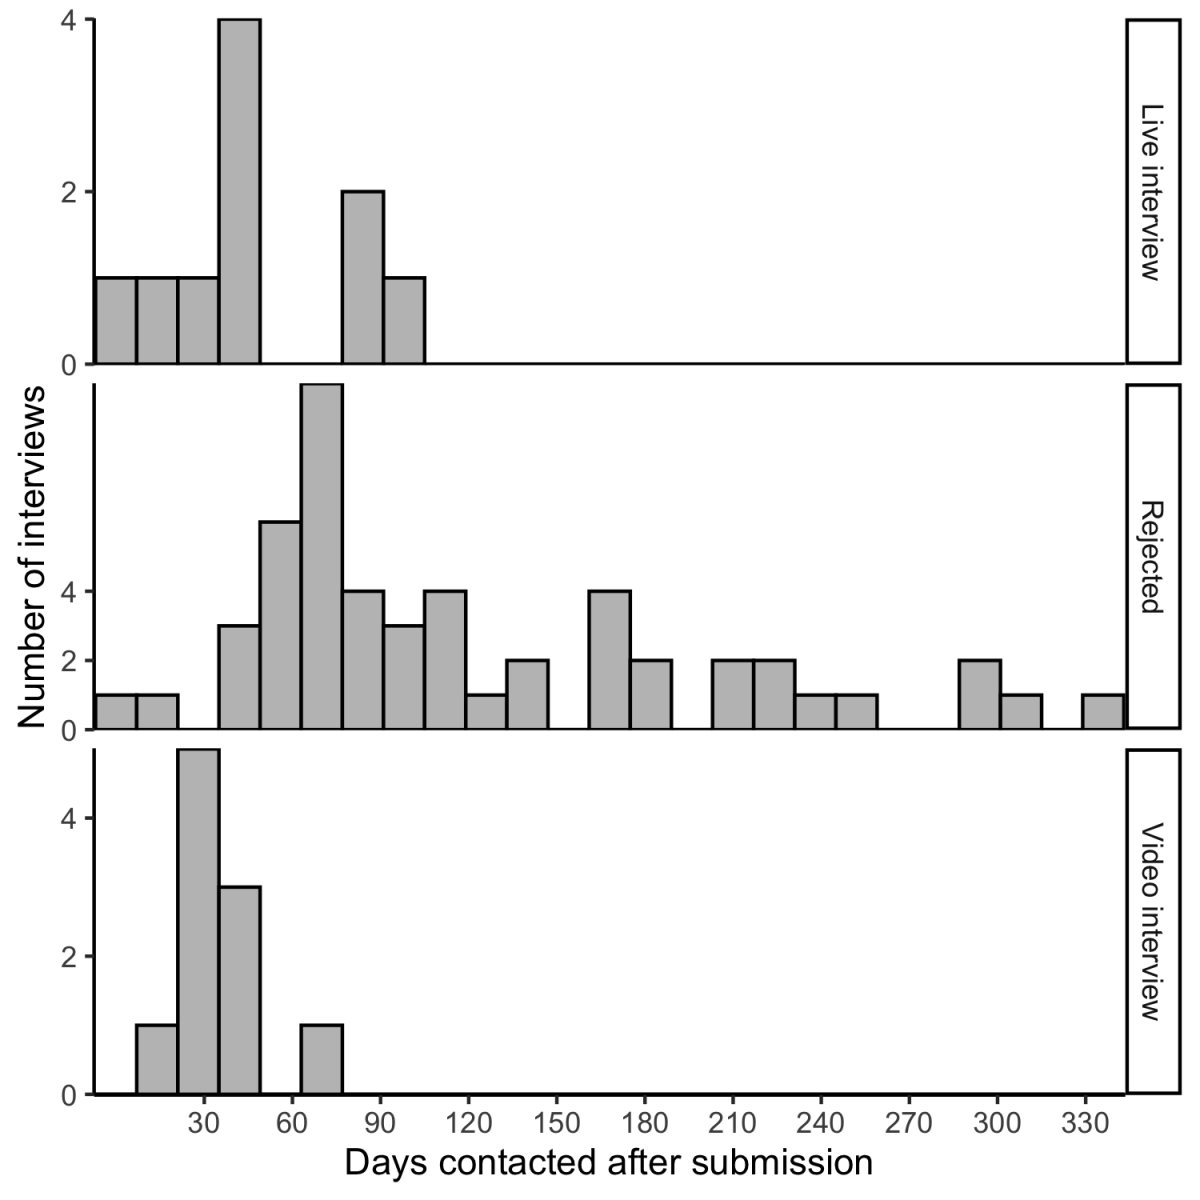
Most of the positive responses happened in the first two months. The first wave of rejections came as a peak between two and three months after the application, though the remaining half of the rejections trickled in over the next year. Based on the above data, any applications that didn’t receive a positive response within 4 months was destined to be a rejection, in one form or another.
Anonymized data and analysis code can be found here.