US Biomedical Research Communities Over Time
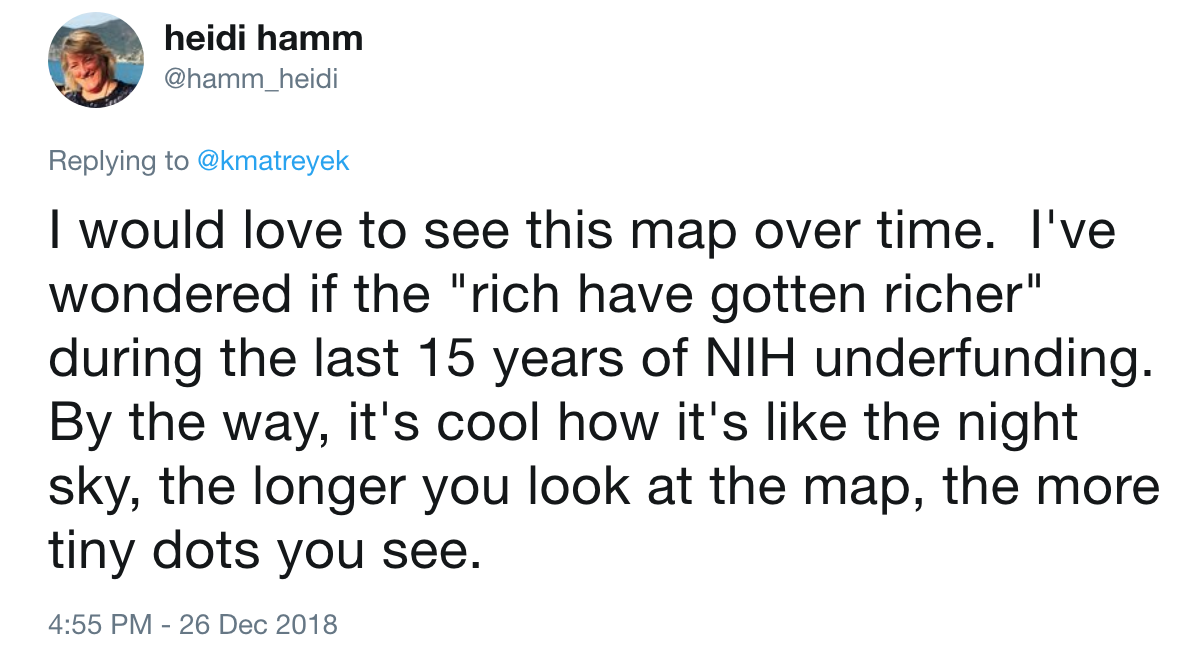
I felt the original post got a decent amount of attention on twitter, including a number comments. Of those, this comment from @hamm_heidi was likely my favorite:
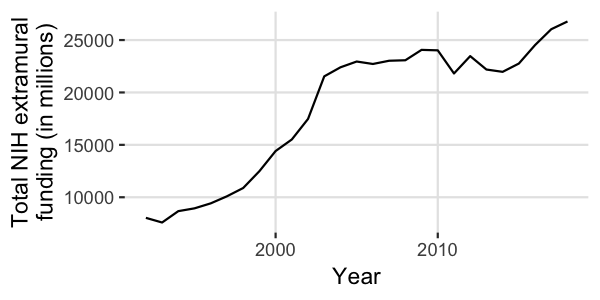
This was certainly doable by grabbing some more data from the RePORTer website (complete data of 1992 through 2018). Firstly, an obvious plot to make: seeing how the total amount of extramural funding has changed over this timespan. It’s definitely increased, though not at a constant rate each year, with the relatively flat line over the last 15 years being the underfunding noted in the above tweet.
The result is a decently-sized dataset; after collapsing all organizations by city/state, there are 2,714 unique US cities that have institutions that have obtained NIH awards during this time frame. I used the same distance-based clustering method I did for the 2018 data in my previous analysis, grouping cities that are within 50 miles of each other.
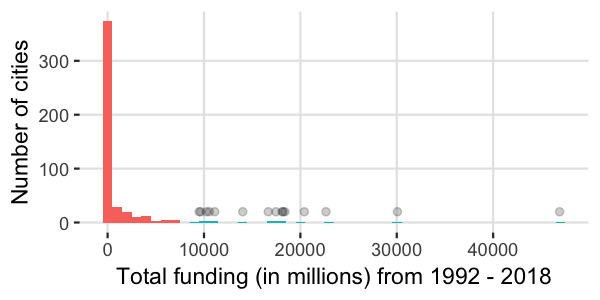
This still resulted in 467 distinct groups / “communities”, which are still way too many to deal with. The vast majority of these are communities that have received relatively little overall funding (ie. probably relatively small research centers). Thus, I decided to mostly work with the 15 top communities that obtain the most NIH funding. They’re colored in cyan (and further accentuated by the black dots above them) in this histogram:
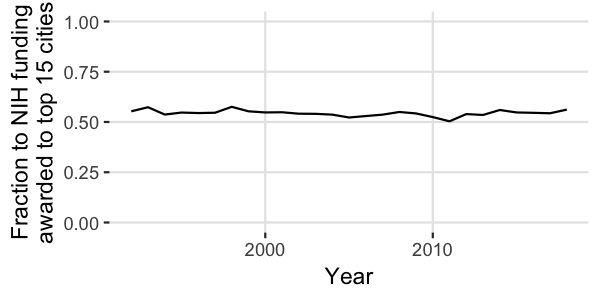
The top 15 research communities account for, on average, 54.4% of the total NIH funding awarded to extramural organizations each year. You can see how steady this has been in the plot below:
When looking into the NIH funding fluctuations for each community during this span, you end up seeing a bit more volatility. Here’s the plot:
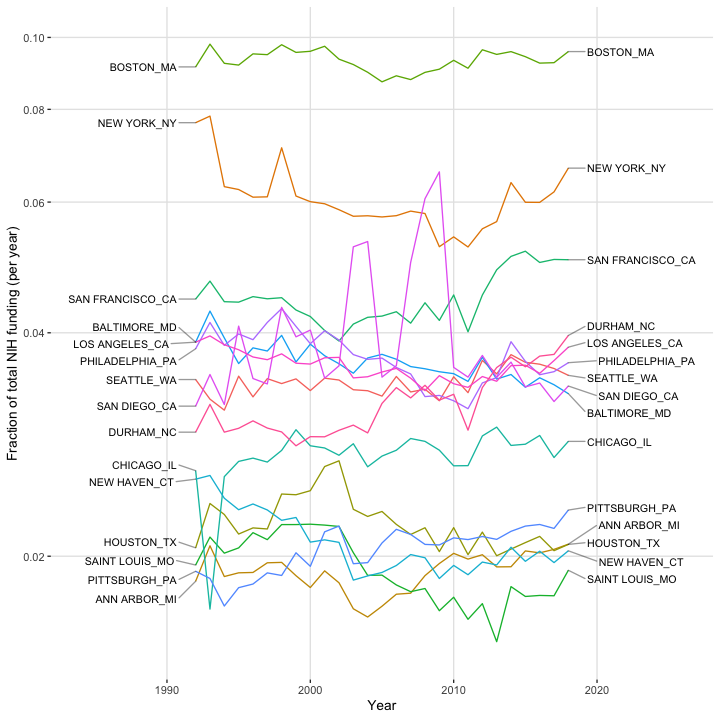
Well, that’s still a pretty crowded plot, so I’ve made a gif that helps walk you through each of the data points:
So some communities have net grown over the last 27 years (eg. San Francisco, Durham, Pittsburgh), whereas some others have shrank (eg. New York, New Haven, Baltimore). You also see some odd things, like the large blips in funding in the San Diego / La Jolla region. Following up on this, turns out this was due to a large amount of extramural NIH funding awarded to Science Applications International Corporation (SAIC), which has since been renamed / rebranded to Leidos, which is “an American defense, aviation, information technology, and biomedical research company that provides scientific, engineering, systems integration, and technical services, and works extensively with the United States Government”. They’re the large driver of these blips, with their awarded funding in 2004 and 2005 being $403 million and $12 million, respectively, and their awarded funding in 2009 and 2010 being $763 million and $8 million, respectively. At some point, the company moved its headquarters to Reston, Virginia, so those blips have disappeared.
So to circle back to the questions / comment that prompted this second analysis: The “rich” have gotten “richer” only in the sense that there has been a net rise in funding over the last 27 years (albeit not inflation adjusted). The “rich” have (somewhat surprisingly, to me) always accounted for roughly the same fraction of NIH funding awarded each year. Within the set of the most “rich”, there have been slight fluctuations in the fraction of annual funding given to each distinct research city / community.