US Biomedical Research Communities
So far, my research career has taken me to UCLA, Harvard, and the University of Washington. For the next step of my research career, I could end up anywhere in the US. With this came the realization that I don’t actually know how representative these research environment / community experiences are to the rest of the potential places in the US I may end up working. Should I expect something entirely different in terms of resources, community, or culture?
To begin to address this, I looked to the data in the NIH RePORTER for statistics on the annual funding amounts awarded to each institution. I grouped the data by city, but was still not content as I knew this was not grouping the entirety of each research community (eg. Boston and Cambridge should be considered part of the same community). Thus, I called latitude/longitude coordinates for each city using the Data Science Toolkit, got all pairwise distances between all 819 cities, and clustered cities (by distance) using hierarchical clustering. I cut the tree to only include groups where the maximum distances between intra-group members were 50-miles, leaving me 229 separate clusters. I consider these to be separate “Research Communities”.
Here’s the corresponding map of the US where the major city from each cluster is shown as points, with each bubble sized according to its total funding amount, and the opacity of each bubble dependent on the total number of awards (which was highly correlated with total funding amount; see below).
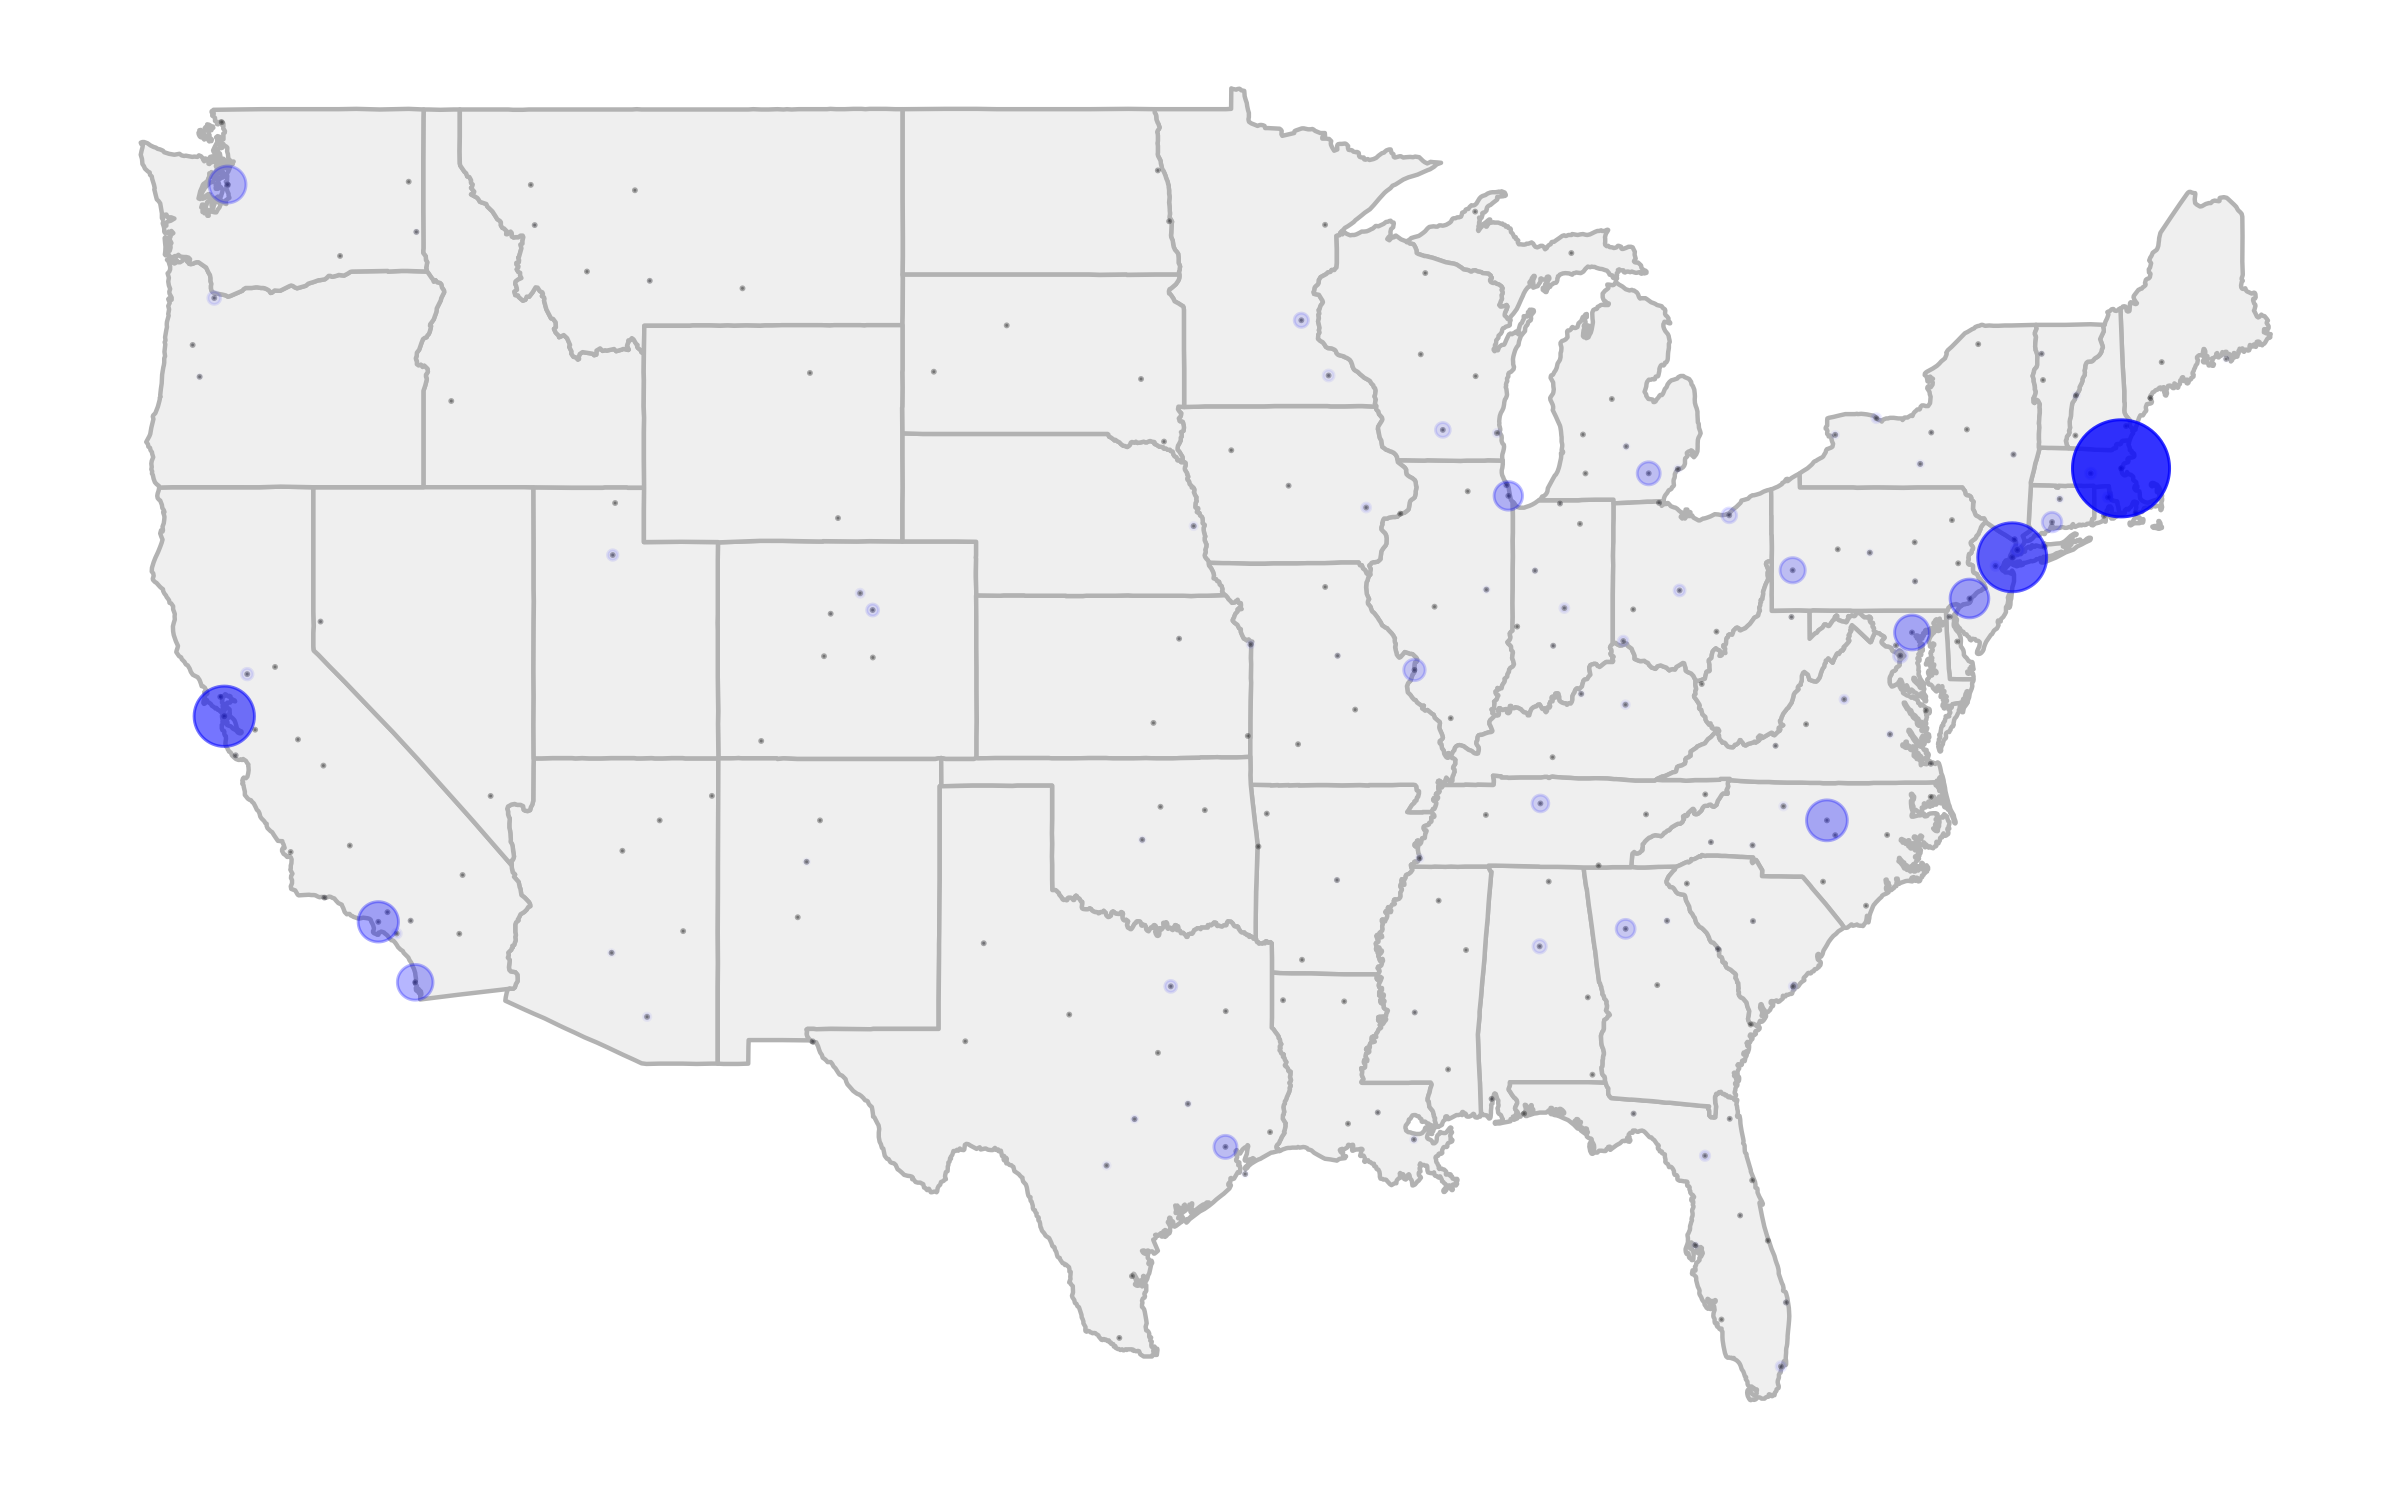
As you can tell by the map, there is a definite coastal bias, with some of the expected big players pretty obvious (eg. Boston area, San Francisco). I actually underestimated how much NIH money was in the New York City area, though it makes a lot of sense in retrospect. Here’s a table of the results:
| group | city | state | annual funding (millions) | awards |
|---|---|---|---|---|
| 1 | BOSTON | MA | 2647.379404 | 4794 |
| 2 | NEW YORK | NY | 1856.049837 | 3648 |
| 3 | SAN FRANCISCO | CA | 1613.687889 | 3239 |
| 4 | DURHAM | NC | 1065.635859 | 1842 |
| 5 | LOS ANGELES | CA | 1049.980965 | 2009 |
| 6 | PHILADELPHIA | PA | 1005.261567 | 2088 |
| 7 | SEATTLE | WA | 955.084314 | 1522 |
| 8 | LA JOLLA | CA | 918.843911 | 1710 |
| 9 | BALTIMORE | MD | 897.321628 | 1848 |
| 10 | CHICAGO | IL | 717.191949 | 1608 |
| 11 | PITTSBURGH | PA | 625.334095 | 1250 |
| 12 | HOUSTON | TX | 564.113359 | 1271 |
| 13 | ANN ARBOR | MI | 562.530715 | 1249 |
| 14 | SAINT LOUIS | MO | 518.772469 | 1072 |
| 15 | NEW HAVEN | CT | 466.434658 | 994 |
| 16 | ATLANTA | GA | 447.658441 | 986 |
| 17 | NASHVILLE | TN | 388.092334 | 849 |
| 18 | CLEVELAND | OH | 332.186487 | 675 |
| 19 | MADISON | WI | 332.030422 | 653 |
| 20 | MINNEAPOLIS | MN | 318.459912 | 719 |
| 21 | WASHINGTON | DC | 303.358981 | 579 |
| 22 | BIRMINGHAM | AL | 293.413142 | 587 |
| 23 | PORTLAND | OR | 274.705734 | 534 |
| 24 | AURORA | CO | 253.082163 | 641 |
| 25 | DALLAS | TX | 250.435769 | 583 |
| 26 | BRONX | NY | 249.238666 | 498 |
| 27 | DAVIS | CA | 240.968518 | 494 |
| 28 | COLUMBUS | OH | 226.226589 | 549 |
| 29 | ROCHESTER | MN | 226.088176 | 404 |
| 30 | SALT LAKE CITY | UT | 209.105125 | 513 |
| 31 | WORCESTER | MA | 205.521402 | 477 |
| 32 | CINCINNATI | OH | 191.573358 | 440 |
| 33 | CORAL GABLES | FL | 187.671298 | 397 |
| 34 | GAINESVILLE | FL | 181.335999 | 441 |
| 35 | PROVIDENCE | RI | 177.566364 | 410 |
| 36 | IRVINE | CA | 177.126587 | 362 |
| 37 | ROCHESTER | NY | 169.69009 | 398 |
| 38 | INDIANAPOLIS | IN | 169.278078 | 355 |
| 39 | IOWA CITY | IA | 168.922326 | 403 |
| 40 | PISCATAWAY | NJ | 162.599992 | 382 |
| 41 | CHARLOTTESVILLE | VA | 150.052283 | 394 |
| 42 | BOULDER | CO | 145.718439 | 364 |
| 43 | LEXINGTON | KY | 134.94632 | 310 |
| 44 | CHARLESTON | SC | 132.368946 | 322 |
| 45 | WINSTON-SALEM | NC | 130.540895 | 255 |
| 46 | TUCSON | AZ | 130.011104 | 276 |
| 47 | MILWAUKEE | WI | 128.291354 | 282 |
| 48 | OMAHA | NE | 123.419242 | 266 |
| 49 | SAN ANTONIO | TX | 119.209378 | 246 |
| 50 | KANSAS CITY | KS | 114.48238 | 265 |
| 51 | MEMPHIS | TN | 112.178482 | 231 |
| 52 | AMHERST | NY | 109.40242 | 264 |
| 53 | ROCKVILLE | MD | 106.974511 | 190 |
| 54 | NEW ORLEANS | LA | 102.171044 | 205 |
| 55 | HANOVER | NH | 101.658468 | 216 |
| 56 | DETROIT | MI | 100.722011 | 232 |
| 57 | TEMPE | AZ | 96.419453 | 204 |
| 58 | ITHACA | NY | 95.211216 | 245 |
| 59 | AUSTIN | TX | 89.629848 | 298 |
| 60 | FARMINGTON | CT | 87.73937 | 225 |
| 61 | TAMPA | FL | 85.787974 | 175 |
| 62 | GALVESTON | TX | 84.170354 | 167 |
| 63 | RICHMOND | VA | 83.614454 | 238 |
| 64 | OKLAHOMA CITY | OK | 82.806887 | 177 |
| 65 | ALBUQUERQUE | NM | 82.01337 | 163 |
| 66 | BAR HARBOR | ME | 79.759078 | 127 |
| 67 | CHAMPAIGN | IL | 78.912638 | 215 |
| 68 | UNIVERSITY PARK | PA | 75.45165 | 190 |
| 69 | EAST LANSING | MI | 73.48425 | 193 |
| 70 | RESEARCH TRIANGLE | NC | 71.747136 | 117 |
| 71 | STONY BROOK | NY | 70.828814 | 209 |
| 72 | LOUISVILLE | KY | 68.366519 | 165 |
| 73 | EVANSTON | IL | 67.453466 | 197 |
| 74 | COLLEGE STATION | TX | 65.806556 | 203 |
| 75 | ATHENS | GA | 65.735147 | 155 |
| 76 | JUPITER | FL | 61.823641 | 122 |
| 77 | NEWARK | DE | 60.758057 | 122 |
| 78 | BURLINGTON | VT | 56.939476 | 120 |
| 79 | ALBANY | NY | 55.686519 | 142 |
| 80 | HERSHEY | PA | 53.273163 | 123 |
| 81 | EUGENE | OR | 50.571811 | 119 |
| 82 | WEST LAFAYETTE | IN | 50.249558 | 155 |
| 83 | LITTLE ROCK | AR | 50.059408 | 93 |
| 84 | COLUMBIA | MO | 49.517631 | 138 |
| 85 | AUGUSTA | GA | 47.663342 | 108 |
| 86 | PULLMAN | WA | 45.557797 | 118 |
| 87 | COLUMBIA | SC | 43.468183 | 98 |
| 88 | SANTA CRUZ | CA | 39.599484 | 77 |
| 89 | TALLAHASSEE | FL | 37.72346 | 94 |
| 90 | BLOOMINGTON | IN | 31.743822 | 103 |
| 91 | RALEIGH | NC | 31.669777 | 102 |
| 92 | JACKSONVILLE | FL | 30.683478 | 49 |
| 93 | BLACKSBURG | VA | 30.636308 | 96 |
| 94 | RIVERSIDE | CA | 29.929642 | 88 |
| 95 | JACKSON | MS | 29.790062 | 64 |
| 96 | BATON ROUGE | LA | 28.856999 | 61 |
| 97 | ORANGEBURG | NY | 28.381356 | 64 |
| 98 | MORGANTOWN | WV | 27.768343 | 63 |
| 99 | SANTA BARBARA | CA | 26.224798 | 68 |
| 100 | RENO | NV | 24.850501 | 47 |
| 101 | SYRACUSE | NY | 24.29689 | 78 |
| 102 | BOZEMAN | MT | 23.45062 | 45 |
| 103 | NOVATO | CA | 23.43383 | 46 |
| 104 | EL PASO | TX | 22.817925 | 45 |
| 105 | NOTRE DAME | IN | 20.512454 | 52 |
| 106 | PORTLAND | ME | 19.010488 | 30 |
| 107 | CORVALLIS | OR | 18.063428 | 48 |
| 108 | KINGSTON | RI | 17.589297 | 99 |
| 109 | GRAND RAPIDS | MI | 16.341949 | 32 |
| 110 | AMES | IA | 16.341844 | 51 |
| 111 | CLEMSON | SC | 15.679785 | 28 |
| 112 | SIOUX FALLS | SD | 15.427308 | 17 |
| 113 | ORLANDO | FL | 15.400278 | 43 |
| 114 | LUBBOCK | TX | 15.090183 | 44 |
| 115 | MARSHFIELD | WI | 14.68387 | 5 |
| 116 | MANHATTAN | KS | 14.310955 | 42 |
| 117 | MISSOULA | MT | 14.297658 | 37 |
| 118 | TOLEDO | OH | 14.231069 | 36 |
| 119 | HUNTSVILLE | AL | 14.082515 | 13 |
| 120 | LARAMIE | WY | 13.856071 | 16 |
| 121 | GRAND FORKS | ND | 13.466647 | 20 |
| 122 | MONROVIA | CA | 12.567787 | 23 |
| 123 | SHREVEPORT | LA | 12.146812 | 29 |
| 124 | MOBILE | AL | 12.022875 | 36 |
| 125 | RICHLAND | WA | 11.708035 | 17 |
| 126 | NORFOLK | VA | 11.152856 | 38 |
| 127 | WOODS HOLE | MA | 10.9381 | 32 |
| 128 | LOMA LINDA | CA | 10.830184 | 29 |
| 129 | LAS VEGAS | NV | 10.719344 | 13 |
| 130 | LIVERMORE | CA | 10.313542 | 24 |
| 131 | KNOXVILLE | TN | 9.439704 | 27 |
| 132 | DAYTON | OH | 9.267817 | 29 |
| 133 | AUBURN UNIVERSITY | AL | 9.06897 | 24 |
| 134 | DANVILLE | PA | 8.890042 | 16 |
| 135 | FLAGSTAFF | AZ | 8.097707 | 10 |
| 136 | JOHNSON CITY | TN | 7.71357 | 23 |
| 137 | GREENVILLE | NC | 7.704072 | 30 |
| 138 | HUNTINGTON | WV | 7.608947 | 7 |
| 139 | VERMILLION | SD | 7.585828 | 18 |
| 140 | FARGO | ND | 7.568713 | 15 |
| 141 | MERCED | CA | 7.028605 | 22 |
| 142 | SPRINGFIELD | IL | 6.951095 | 11 |
| 143 | STILLWATER | OK | 6.437718 | 16 |
| 144 | BETHLEHEM | PA | 6.414142 | 18 |
| 145 | EDINBURG | TX | 6.002395 | 15 |
| 146 | BOISE | ID | 5.914325 | 10 |
| 147 | TULSA | OK | 5.451189 | 6 |
| 148 | HATTIESBURG | MS | 5.426449 | 4 |
| 149 | UNIVERSITY | MS | 5.318222 | 13 |
| 150 | ST. PAUL | MN | 5.309479 | 9 |
| 151 | MISSISSIPPI STATE | MS | 4.785458 | 10 |
| 152 | FAYETTEVILLE | AR | 4.433915 | 13 |
| 153 | LOS ALAMOS | NM | 4.367963 | 11 |
| 154 | ATHENS | OH | 4.308147 | 11 |
| 155 | TYLER | TX | 4.1291 | 13 |
| 156 | DURHAM | NH | 3.937952 | 9 |
| 157 | DOVER | DE | 3.717299 | 8 |
| 158 | WICHITA | KS | 3.517968 | 3 |
| 159 | CARBONDALE | IL | 3.341975 | 11 |
| 160 | KALAMAZOO | MI | 3.203297 | 7 |
| 161 | DENTON | TX | 2.729782 | 10 |
| 162 | LOGAN | UT | 2.525725 | 8 |
| 163 | WACO | TX | 2.272581 | 7 |
| 164 | LAFAYETTE | LA | 2.215532 | 3 |
| 165 | FUQUAY VARINA | NC | 2.149723 | 6 |
| 166 | MOUNT PLEASANT | MI | 2.12931 | 7 |
| 167 | HOUGHTON | MI | 1.95425 | 5 |
| 168 | SPRINGFIELD | MO | 1.759795 | 2 |
| 169 | SAN LUIS OBISPO | CA | 1.546307 | 6 |
| 170 | MELBOURNE | FL | 1.472552 | 3 |
| 171 | COLORADO SPRINGS | CO | 1.437185 | 5 |
| 172 | NORTH WEBSTER | IN | 1.372833 | 4 |
| 173 | WHITERIVER | AZ | 1.344707 | 2 |
| 174 | BILLINGS | MT | 1.338972 | 2 |
| 175 | SPOKANE | WA | 1.157481 | 4 |
| 176 | RAPID CITY | SD | 1.148682 | 2 |
| 177 | BELLINGHAM | WA | 1.108736 | 5 |
| 178 | DE KALB | IL | 1.066215 | 3 |
| 179 | FRESNO | CA | 0.973636 | 7 |
| 180 | DAVENPORT | IA | 0.96552 | 3 |
| 181 | KINGSVILLE | TX | 0.965045 | 5 |
| 182 | LAC DU FLAMBEAU | WI | 0.944531 | 1 |
| 183 | MACON | GA | 0.913288 | 2 |
| 184 | PEMBROKE | NC | 0.88802 | 3 |
| 185 | POTSDAM | NY | 0.843875 | 4 |
| 186 | BOWLING GREEN | KY | 0.830798 | 2 |
| 187 | WILMINGTON | NC | 0.829924 | 2 |
| 188 | MIDDLEBURY | VT | 0.808639 | 2 |
| 189 | UTICA | NY | 0.797333 | 1 |
| 190 | EL DORADO HILLS | CA | 0.770035 | 3 |
| 191 | SOCORRO | NM | 0.768367 | 2 |
| 192 | TSAILE | AZ | 0.717571 | 1 |
| 193 | MONROE | LA | 0.705226 | 2 |
| 194 | SPRINGFIELD | VA | 0.637692 | 1 |
| 195 | ALLENTOWN | PA | 0.59258 | 2 |
| 196 | TEMECULA | CA | 0.56395 | 2 |
| 197 | PABLO | MT | 0.546609 | 2 |
| 198 | FORT SMITH | AR | 0.545845 | 2 |
| 199 | BURGESS | VA | 0.514913 | 2 |
| 200 | ODESSA | TX | 0.497717 | 1 |
| 201 | FORT MYERS | FL | 0.493091 | 1 |
| 202 | KEENE | NH | 0.416179 | 1 |
| 203 | SILVERTHORNE | CO | 0.409 | 43 |
| 204 | OSHKOSH | WI | 0.407519 | 1 |
| 205 | GREAT FALLS | MT | 0.405 | 1 |
| 206 | KIRKSVILLE | MO | 0.382343 | 1 |
| 207 | DURANGO | CO | 0.359992 | 2 |
| 208 | BAKERSFIELD | CA | 0.356689 | 1 |
| 209 | SAVANNAH | GA | 0.353266 | 3 |
| 210 | STORM LAKE | IA | 0.329633 | 1 |
| 211 | KYKOTSMOVI | AZ | 0.307815 | 1 |
| 212 | TERRE HAUTE | IN | 0.305308 | 1 |
| 213 | SMYRNA | TN | 0.299244 | 1 |
| 214 | ROLLA | MO | 0.280072 | 3 |
| 215 | DOTHAN | AL | 0.277277 | 1 |
| 216 | BUENA VISTA | CO | 0.2561 | 1 |
| 217 | BUTTE | MT | 0.249307 | 1 |
| 218 | CHATTANOOGA | TN | 0.236791 | 2 |
| 219 | WINTHROP | ME | 0.232182 | 2 |
| 220 | MAGNOLIA | AR | 0.225 | 1 |
| 221 | SOUTH SAN FRANCISCO | MI | 0.224944 | 1 |
| 222 | BUFFALO | WY | 0.223848 | 1 |
| 223 | PENSACOLA | FL | 0.163576 | 3 |
| 224 | BEAUMONT | TX | 0.1326 | 1 |
| 225 | ELIZABETH CITY | NC | 0.118781 | 1 |
| 226 | EAGLE BUTTE | SD | 0.097019 | 1 |
| 227 | DAYTONA BEACH | FL | 0.09475 | 1 |
| 228 | PITTSBURG | KS | 0.069114 | 1 |
| 229 | SCRANTON | PA | 0.058594 | 1 |
Surprisingly, Seattle came in at #7 in NIH funding, and Los Angeles came in at #5. With Boston the far-and-away #1, I guess this means I do indeed have a pretty biased view of research communities. That said, I’ve looked pretty deeply into a number of places already, and I suspect anything in the top 75 or so still have communities large enough to do what I want / need to do. And with things like video-conferencing now, it’s pretty easy to converse with people further away, anyways.
CAVEAT CAVEAT CAVEAT (My usual caveat statement):
1) Yes, I realize this is only NIH-funded award. Certainly other forms of national money like NSF or private money like HHMI matter a lot (and certainly from the individual investigator perspective), and are not taken into account my this analysis. Still, NIH-awarded money drives the brunt of biomedical research, so I don’t think this exclusion will lead to any overly misleading results.
2) Obviously, don’t take these rankings to mean anything about research community quality or anything. Just a data-driven metric to semi-quantitatively assess sheer research community size.
PS. Here’s the plot of award # vs total award amounts:
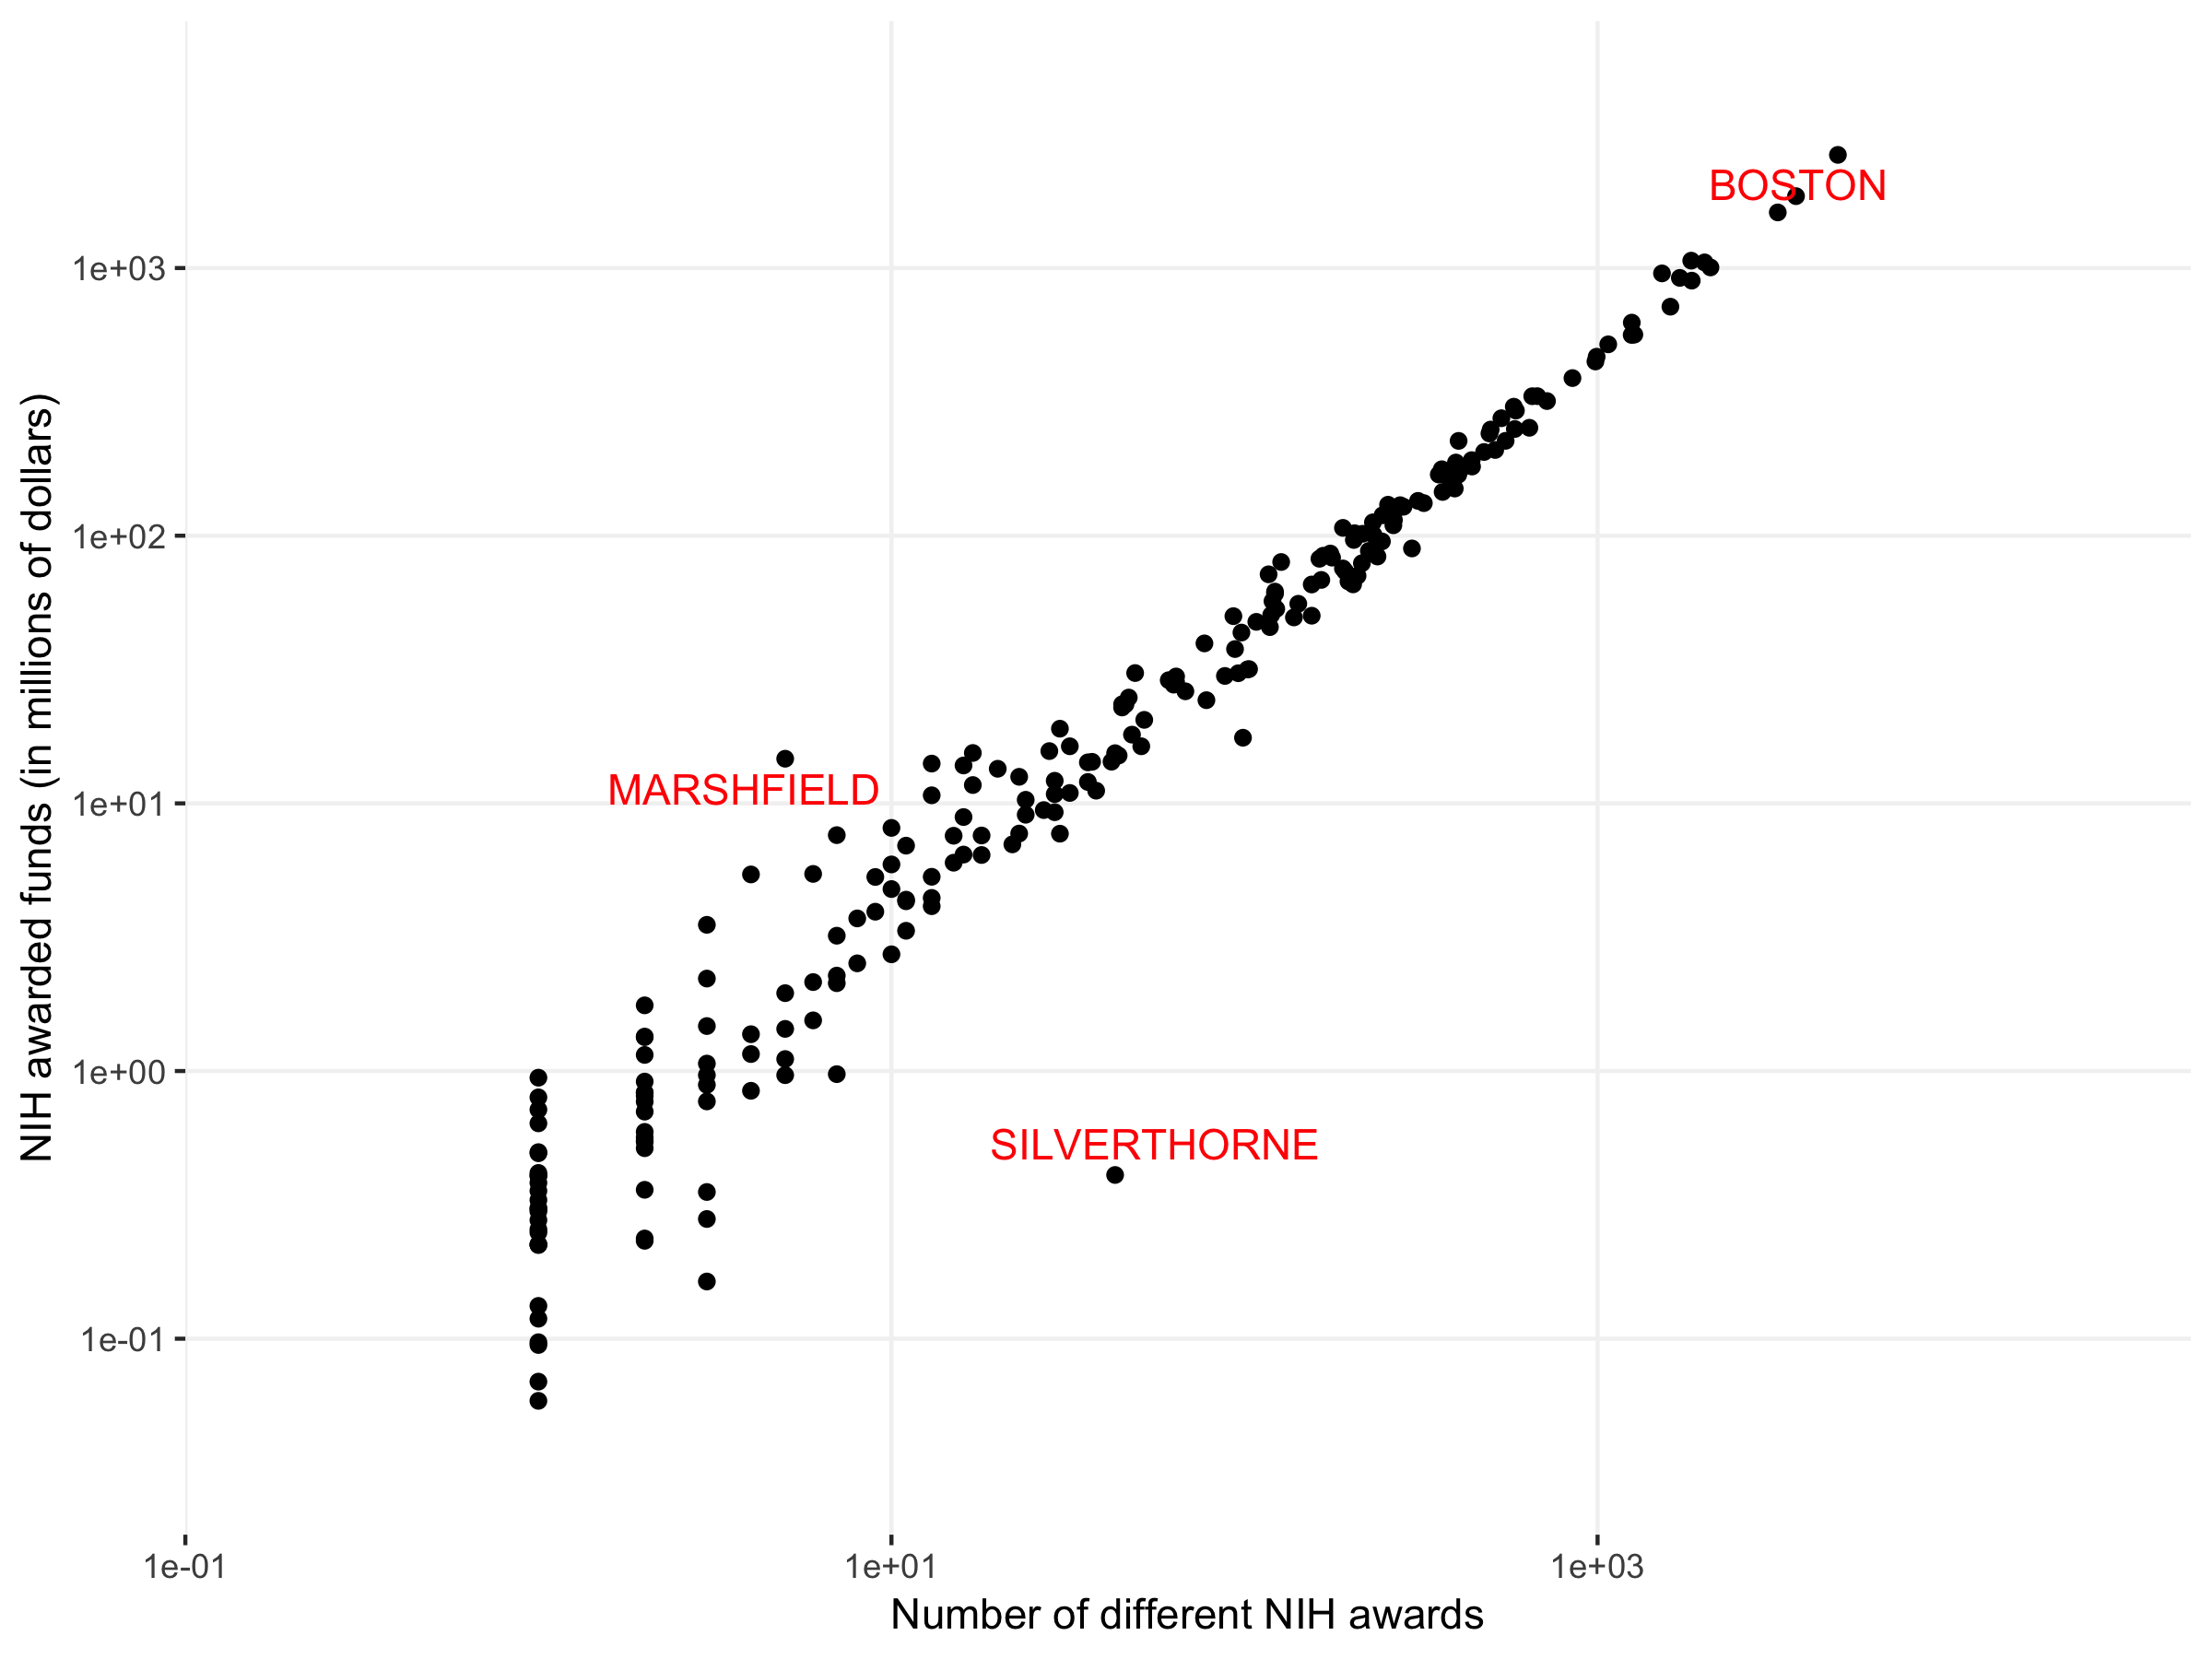
As you can see, it correlates pretty nicely, with a few outliers. Silverthorne is apparently where the Keystone Symposia are based. Marshfield is apparently the base of a regional health-care system that must have a handful of decently-sized grants.
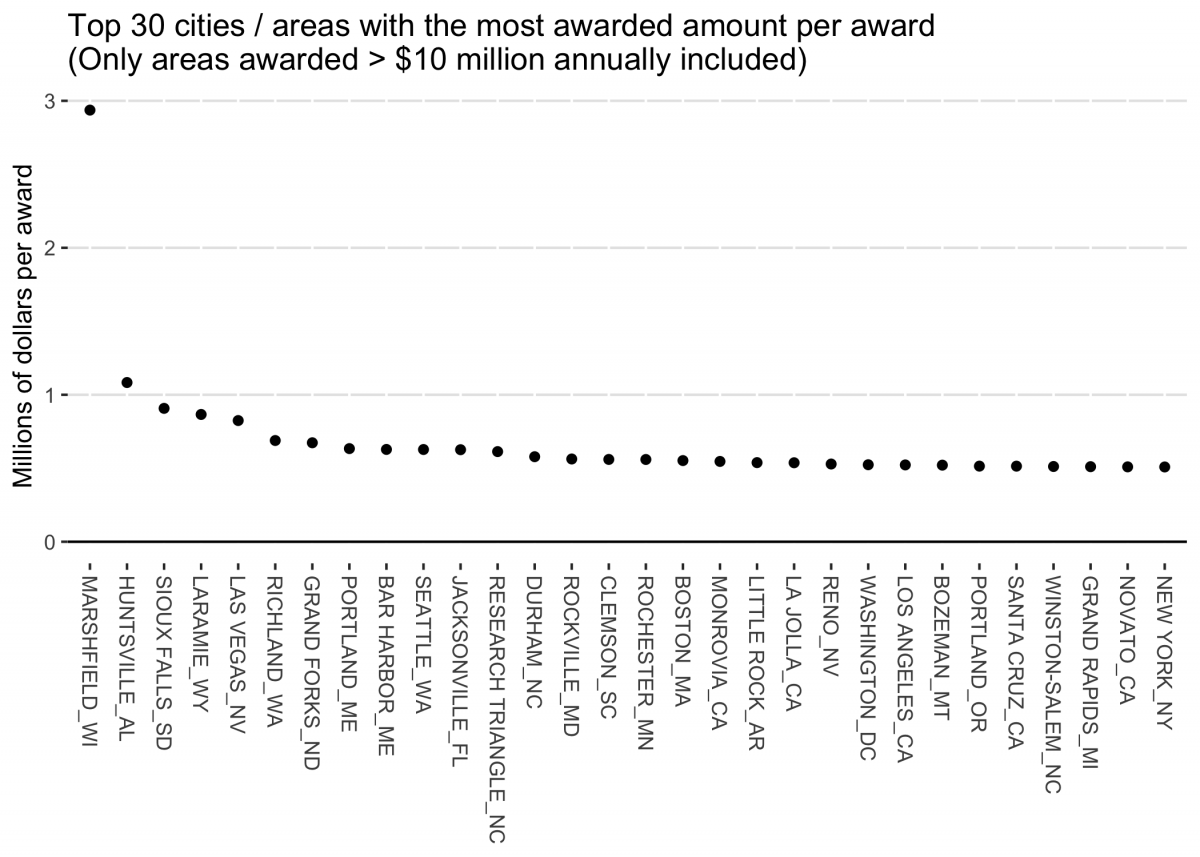
EDIT 1:
By request, here’s a plot of the top 30 places (awarded greater than $10M annually) with the highest amount of money awarded per grant. I ended up making the 10M subset since there were a lot of random, small places which completely overtook the plot otherwise. Sometime in the future, after I figure out where to get population data, I’ll perform the other request where I divide area NIH awarded amount by area population.
EDIT 2:
OK, I had a number of different people express interest in having the funding amounts divided by city population, so I pulled data from the US census and did just that. A huge caveat is that this is ONLY looking at population of the “major” city in the group / cluster, and does not take into account the entire population of the cluster (that would require a fair bit more work, which I’m unwilling to devote right now). The results:
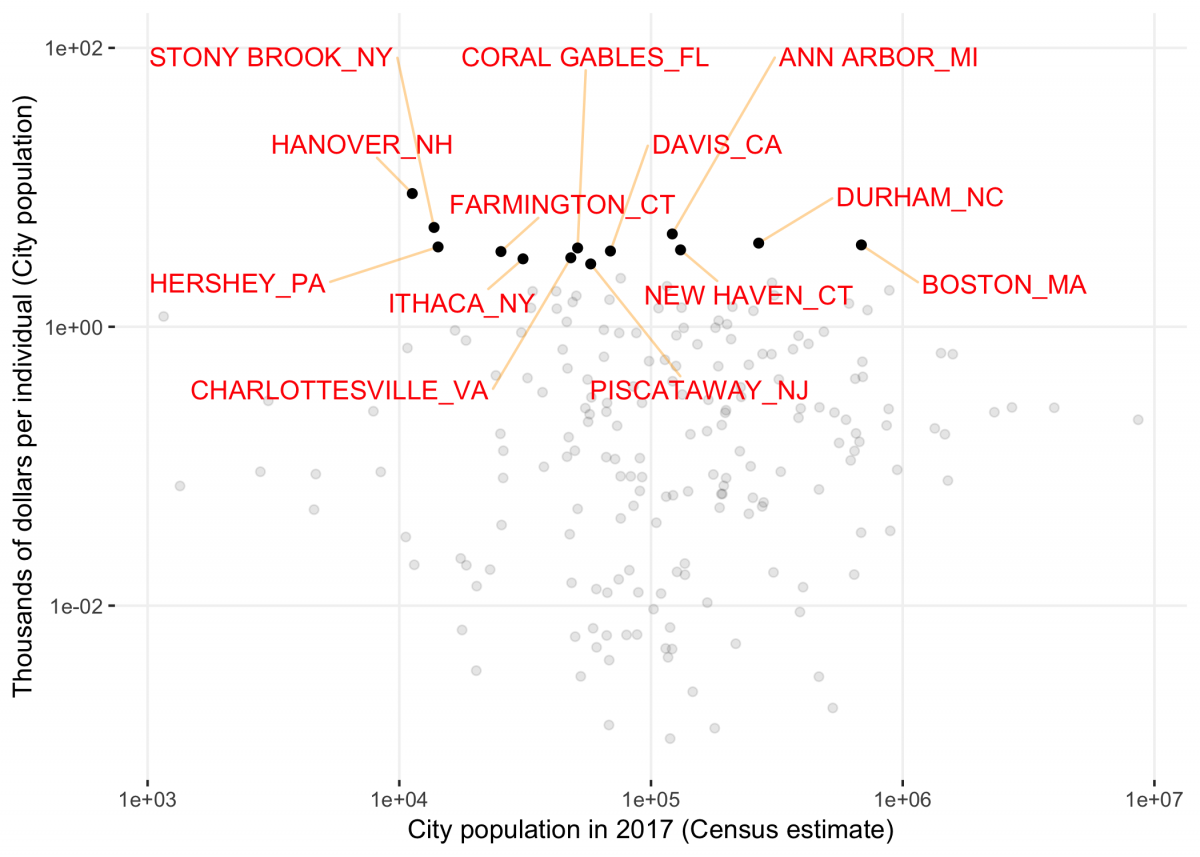
So there’s a pretty big cloud of points. I’ve highlighted the places with the most NIH funding per individual in the city (general population). You start seeing many more “college towns” pop up. Makes sense. Now all of the people at Yale and U Michigan can feel more content now. 😉
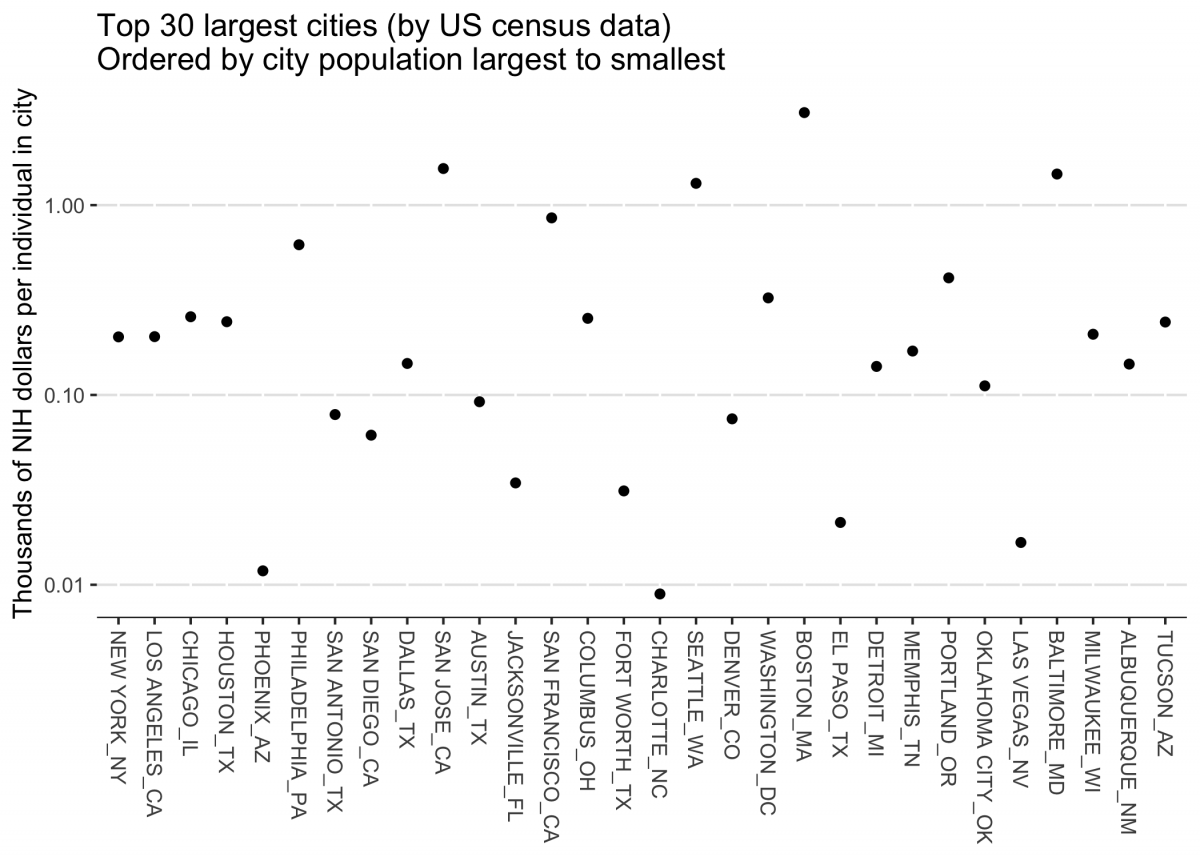
EDIT 3:
Thought I was done, but figured I’d do one more analysis I’m assuming some people care about. I subsetted on the most populous cities by the US census, and then looked at those cities NIH funding divided by the population. San Francisco doesn’t end up in this plot b/c of it’s small population (within city limits), so I let San Jose represent the bay area. Big caveat here is that I’m only using census data that represents population within the city, rather than metro areas.