(Im)Practical Spectro-photometry
I recently bought some colored plastic sheets, that I could use for various projects. They actually came in handy for fashioning my own red-blue 3D glasses for viewing this 3D picture that I made.
Aside from me, other people were curious about what wavelengths were being filtered by these sheets, as witnessed by these questions in the questions / answers part of the Amazon page: “Any spectral transmission data (curves) for these?“, and “Do you know the actual wavelengths that pass through each of these filters?“. Well, Amazon users “Paul” and … “Frog”, you guys are in luck.
At some point over the weekend, I realized I could answer this question quite easily, as spectrophotometers are rather common in biomedical research labs, like the one where I work. Sure, there are fancy plate readers nowadays, but even the most basic labs have basic spectrophotometers for quantitating DNA or purified protein concentrations, and bacterial or yeast culture densities. Nanodrops like this one are pretty commonplace (and quite handy).
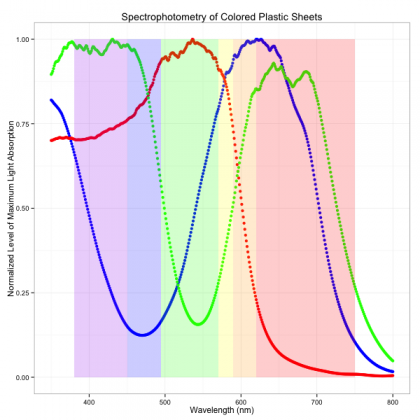
Thus, I cut up some slivers of the red, green, and blue colored plastic sheets, slid them into a cuvette, and scanned the UV-vis spectrum (after first blanking/baselining on an empty cuvette). I imported the data in to R, smoothed out the curves a bit with a moving average function, and voila — absorbance profiles. I overlaid transparent rectangular annotations (roughly) denoting the colors that correspond to that part of the spectrum, for ease of interpretation.
As you can see, the parts of spectrum that are being transmitted through the plastic (ie. the troughs of the curve) correspond well with the color of the plastic film being tested, so the data appears legit.
So there we go. Making scientific discoveries: great. Using (non-consumable) lab equipment to answer a relatively trivial question on Amazon: priceless.
